
 More than ever, understanding GME industry trends is critical to staying ahead of the curve and positioning your programs for success in today’s dynamic and competitive landscape. While our recently published GMAC Prospective Students Survey – 2022 Summary Report is a fantastic resource for giving you insights into the market as a whole, you likely have questions not answered in the report that are more specific to the candidate populations you target for your programs.
That’s where the GMAC Prospective Students Survey – 2022 Interactive Report comes in. As a school professional from a GMAT-accepting institution with a gmac.com login, you have access to this incredibly powerful interactive tool that allows you to examine question-level data from the survey and gather specific insights targeted to your program, region, and/or target populations.
Access the Tool
To get started, click the link below to go to the interactive report landing page.

From there, click “Access the interactive tool” and you’ll be prompted to log into your gmac.com account. When you then again select “Access the interactive tool” you’ll be taken to the interactive tool itself.
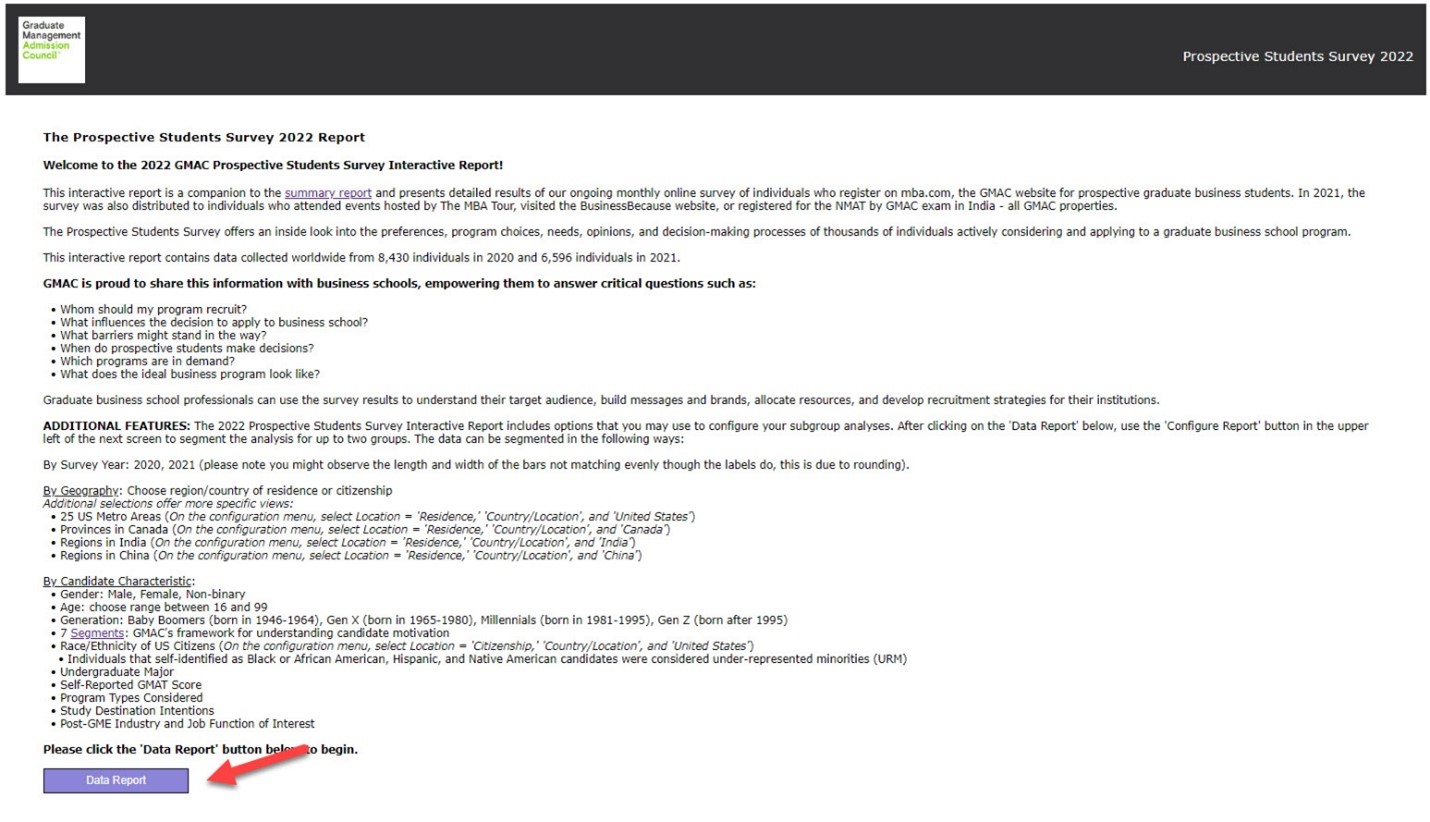
To begin using the tool, click on the purple DATA REPORT button at the button of the screen.
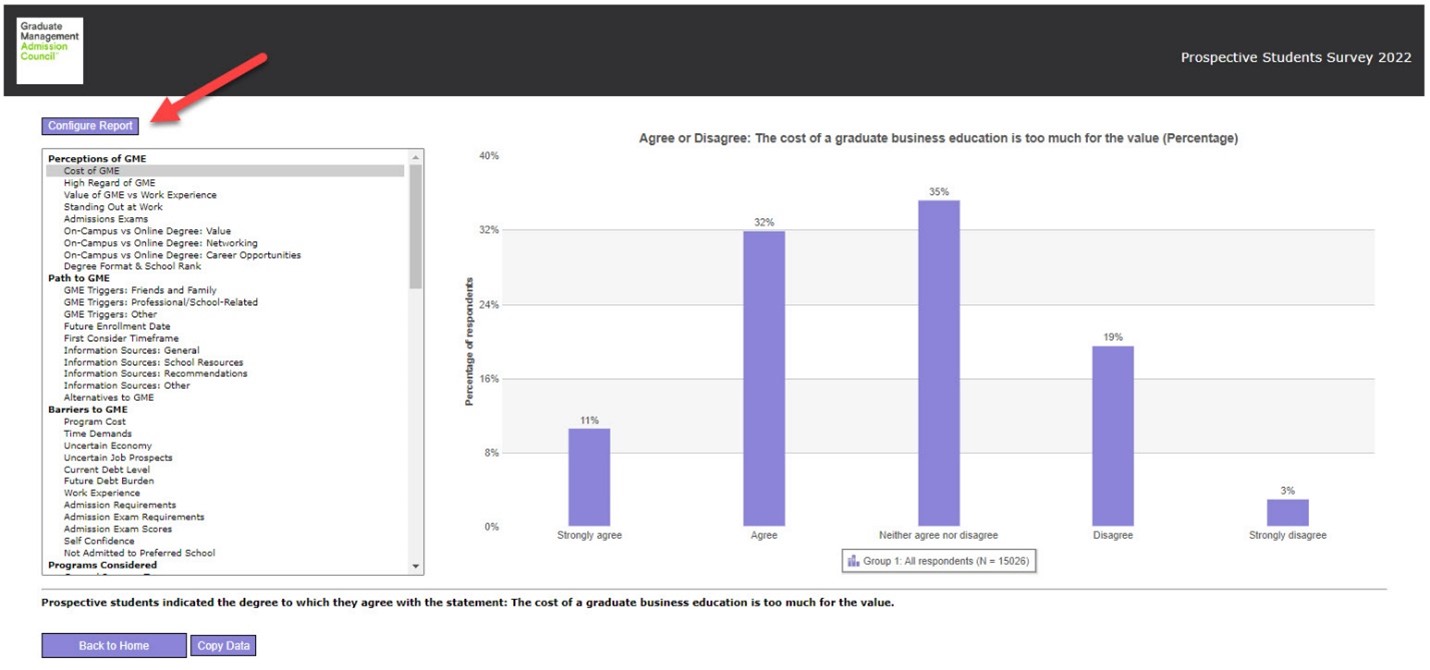
On the left-hand side of the screen, you can scroll through the survey questions which are grouped by topical area. Click on an item to see how candidates responded to the survey question. The first time you are using the tool, you may have to click an item twice, or toggle to another item and back to get it to start working.
Once the chart appears, you will see the statistics for the global sample. At the bottom of the chart, you can see the sample size of survey respondents answering the questions and down in the footnotes you can find more details about the wording of the questions or specific instructions on how to interpret the charts.
Create customized data views
This tool provides the ability to filter the results to a specific population. To do this, click on configure report.
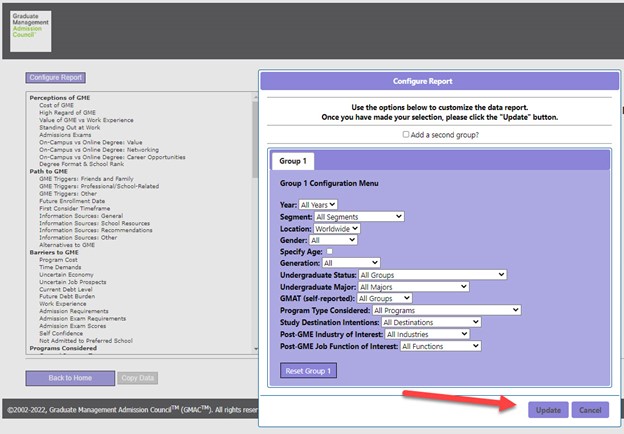
Then you can filter the data on a variety of different variables including survey year, segment, location gender, age, generation, undergraduate status, undergraduate major, self-reported GMAT score, the type of business program candidates are considering, where candidates are planning to apply, and industries and job functions of interest post business school.
Note that for location data you can filter by residence or citizenship. And for residence, you can filter by region or country/location depending on where we have enough samples to report on. And specifically for Canada, China, India, and the US, you can drill down to more specific areas. And by citizenship for the United States, you can filter by racial or ethnic groups.
Once you select your parameters, click update.
And as you can see, the description of your population and the sample size in the box at the bottom of the chart has updated accordingly. Note sometimes you may get an error message indicating the sample size is less than 25 and it can’t run the data. You will need to adjust your filters until the analysis produces a large enough sample size to run.
Comparing different candidate populations
You can also compare two different populations to see how they differ on the survey questions. To do this, again click on the configure report button, check the “Add a second group” box at the top of the screen, go to the tab for group 2, select the parameters for this population, and then click update again.
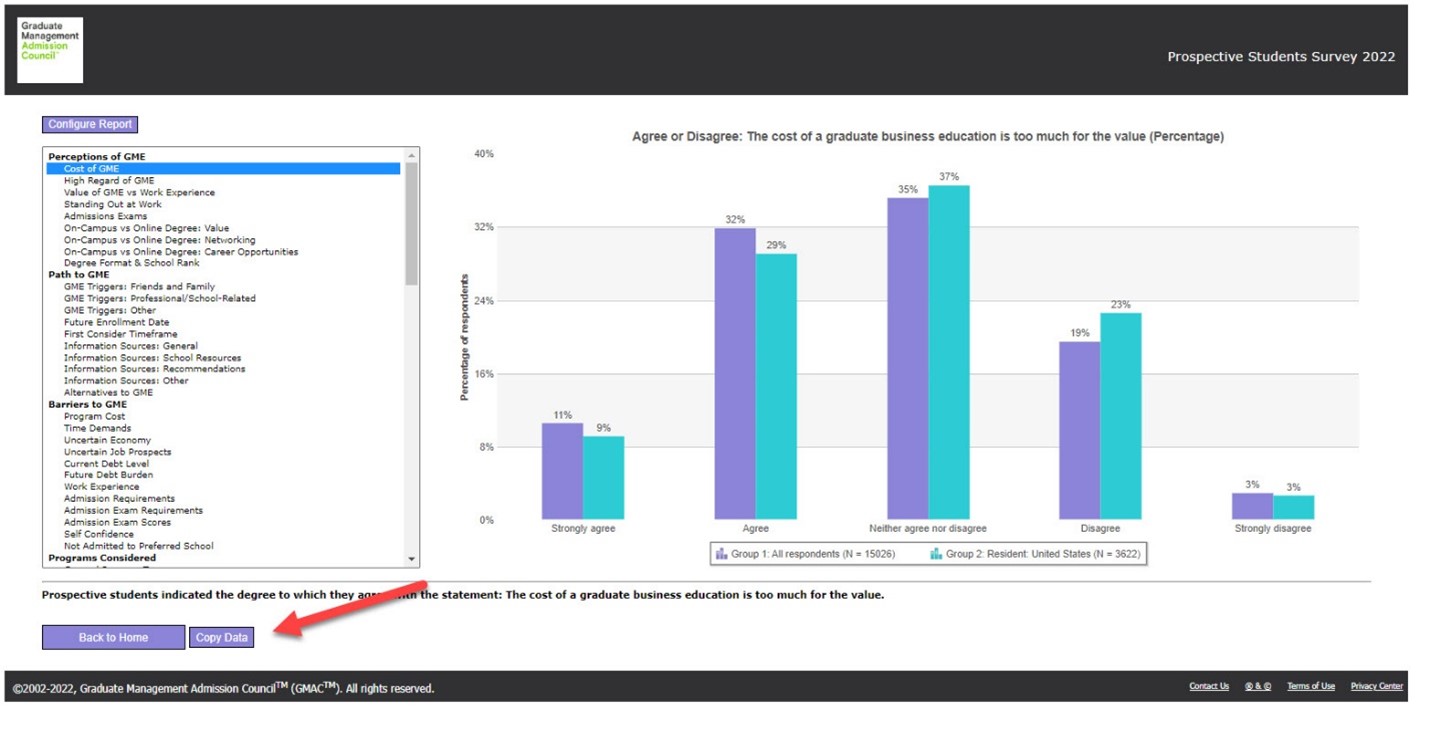
When it does update, you will see two different colored bars, one for each of the two groups. At the bottom of the screen is the legend with descriptions of the population based on the filters you applied and the corresponding sample sizes.
If you want to remove the second group, go back to configure report and uncheck the “add a second group box”. And if you want to remove any of your filters, go down to the bottom of the group and hit “reset”.
Exporting data for your own use
Finally, you can export the data from the chart into Excel. To do this, click copy data and follow the instructions on the prompt where it tells you to hit “Control C” and then click OK. This copies your data. And then paste it into your Excel spreadsheet or another document.
Join our webinar on May 18
Hungry for more data and insights from the GMAC Prospective Students Survey? Join me and my colleague, Alexandria Williams, for our webinar on May 18 when we’ll go beyond what you can read about in the Summary Report and go deeper into the candidate decision-making process. We’ll be giving a 30-minute presentation and will be available for Q&A after that, so come ready to ask your questions and engage with us. Looking forward to having you there!